Stability and Scale
This page presents operational signals from the live BDS mainnet market. Figures are derived from on-chain events on Powerloom L2 (chain 7869) unless noted otherwise.
Reproducibility: Committed analysis artifacts and reproduction commands are in the dsv-validator-activity reports tree (days-1-30/, days-31-60/, days-61-90/, combined-days-1-90/summary.json). Raw log exports are not committed; rerun the scripts with an archive RPC to verify.
Network at a Glance (90 protocol days)
BDS mainnet has operated through 90 protocol days of DSV validator activity (three consecutive 30-day windows). Combined on-chain epoch coverage:
| Metric | Days 1–30 | Days 31–60 | Days 61–90 | Combined 1–90 |
|---|---|---|---|---|
| Epochs assigned | 217,295 | 215,226 | 215,991 | 648,512 |
| Epochs with submissions | 212,297 | 210,430 | 204,416 | 627,143 |
| Completion rate | 97.70% | 97.77% | 94.64% | 96.70% |
| Missed epochs | 4,998 (2.30%) | 4,796 (2.23%) | 11,575 (5.36%) | 21,369 (3.30%) |
| Median latency | 89s | 97s | 97s | — |
| P95 latency | 138s | 155s | 160s | — |
Across 90 days the network sustained 96.7% submission coverage with 96.7% of assigned epochs receiving a submission. End-to-end latency, which had drifted upward between the first two windows, held flat in days 61–90 (median 97s, P95 +5s). Throughout, the same structural pattern holds: once a validator submits, batch completion stays above 99%.
Days 61–90 saw a temporary coverage dip to 94.64%, concentrated in the final week of the window. This was traced to an infrastructure issue on the bootstrap node — not the validator set — and resolved; see Days 61–90 below.
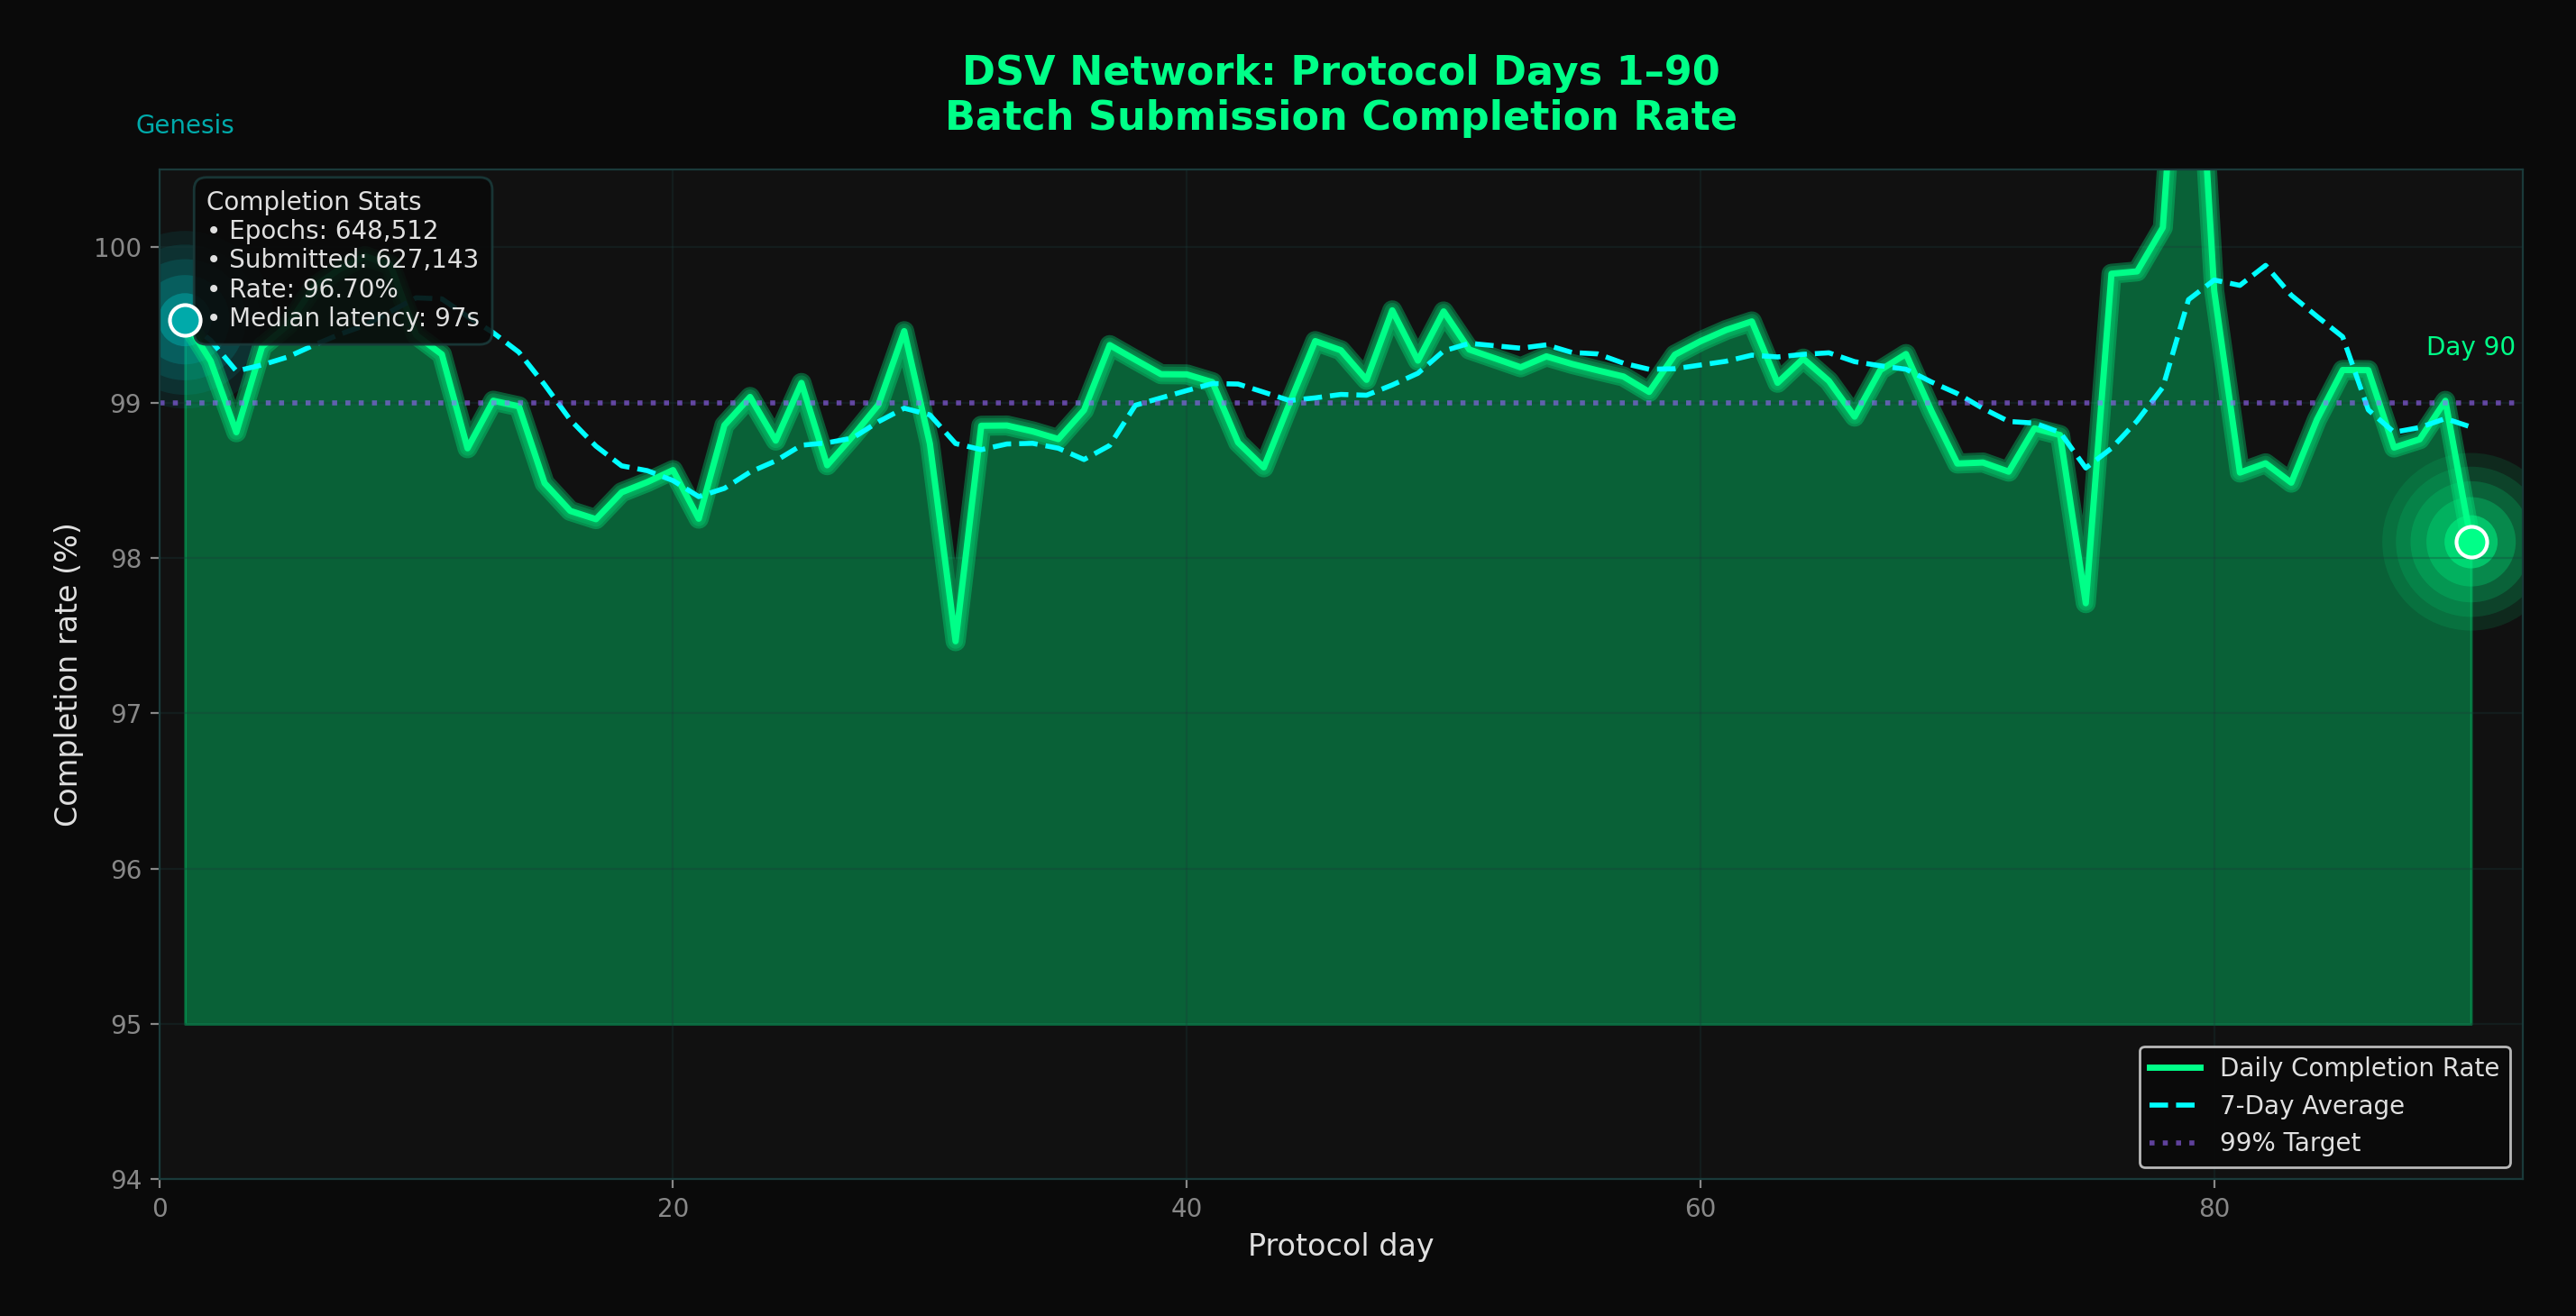
Figure 1: Daily batch submission completion rate across all 90 protocol days (648,512 epochs assigned). Batch-level completion (submit → on-chain complete) holds above 99% throughout.
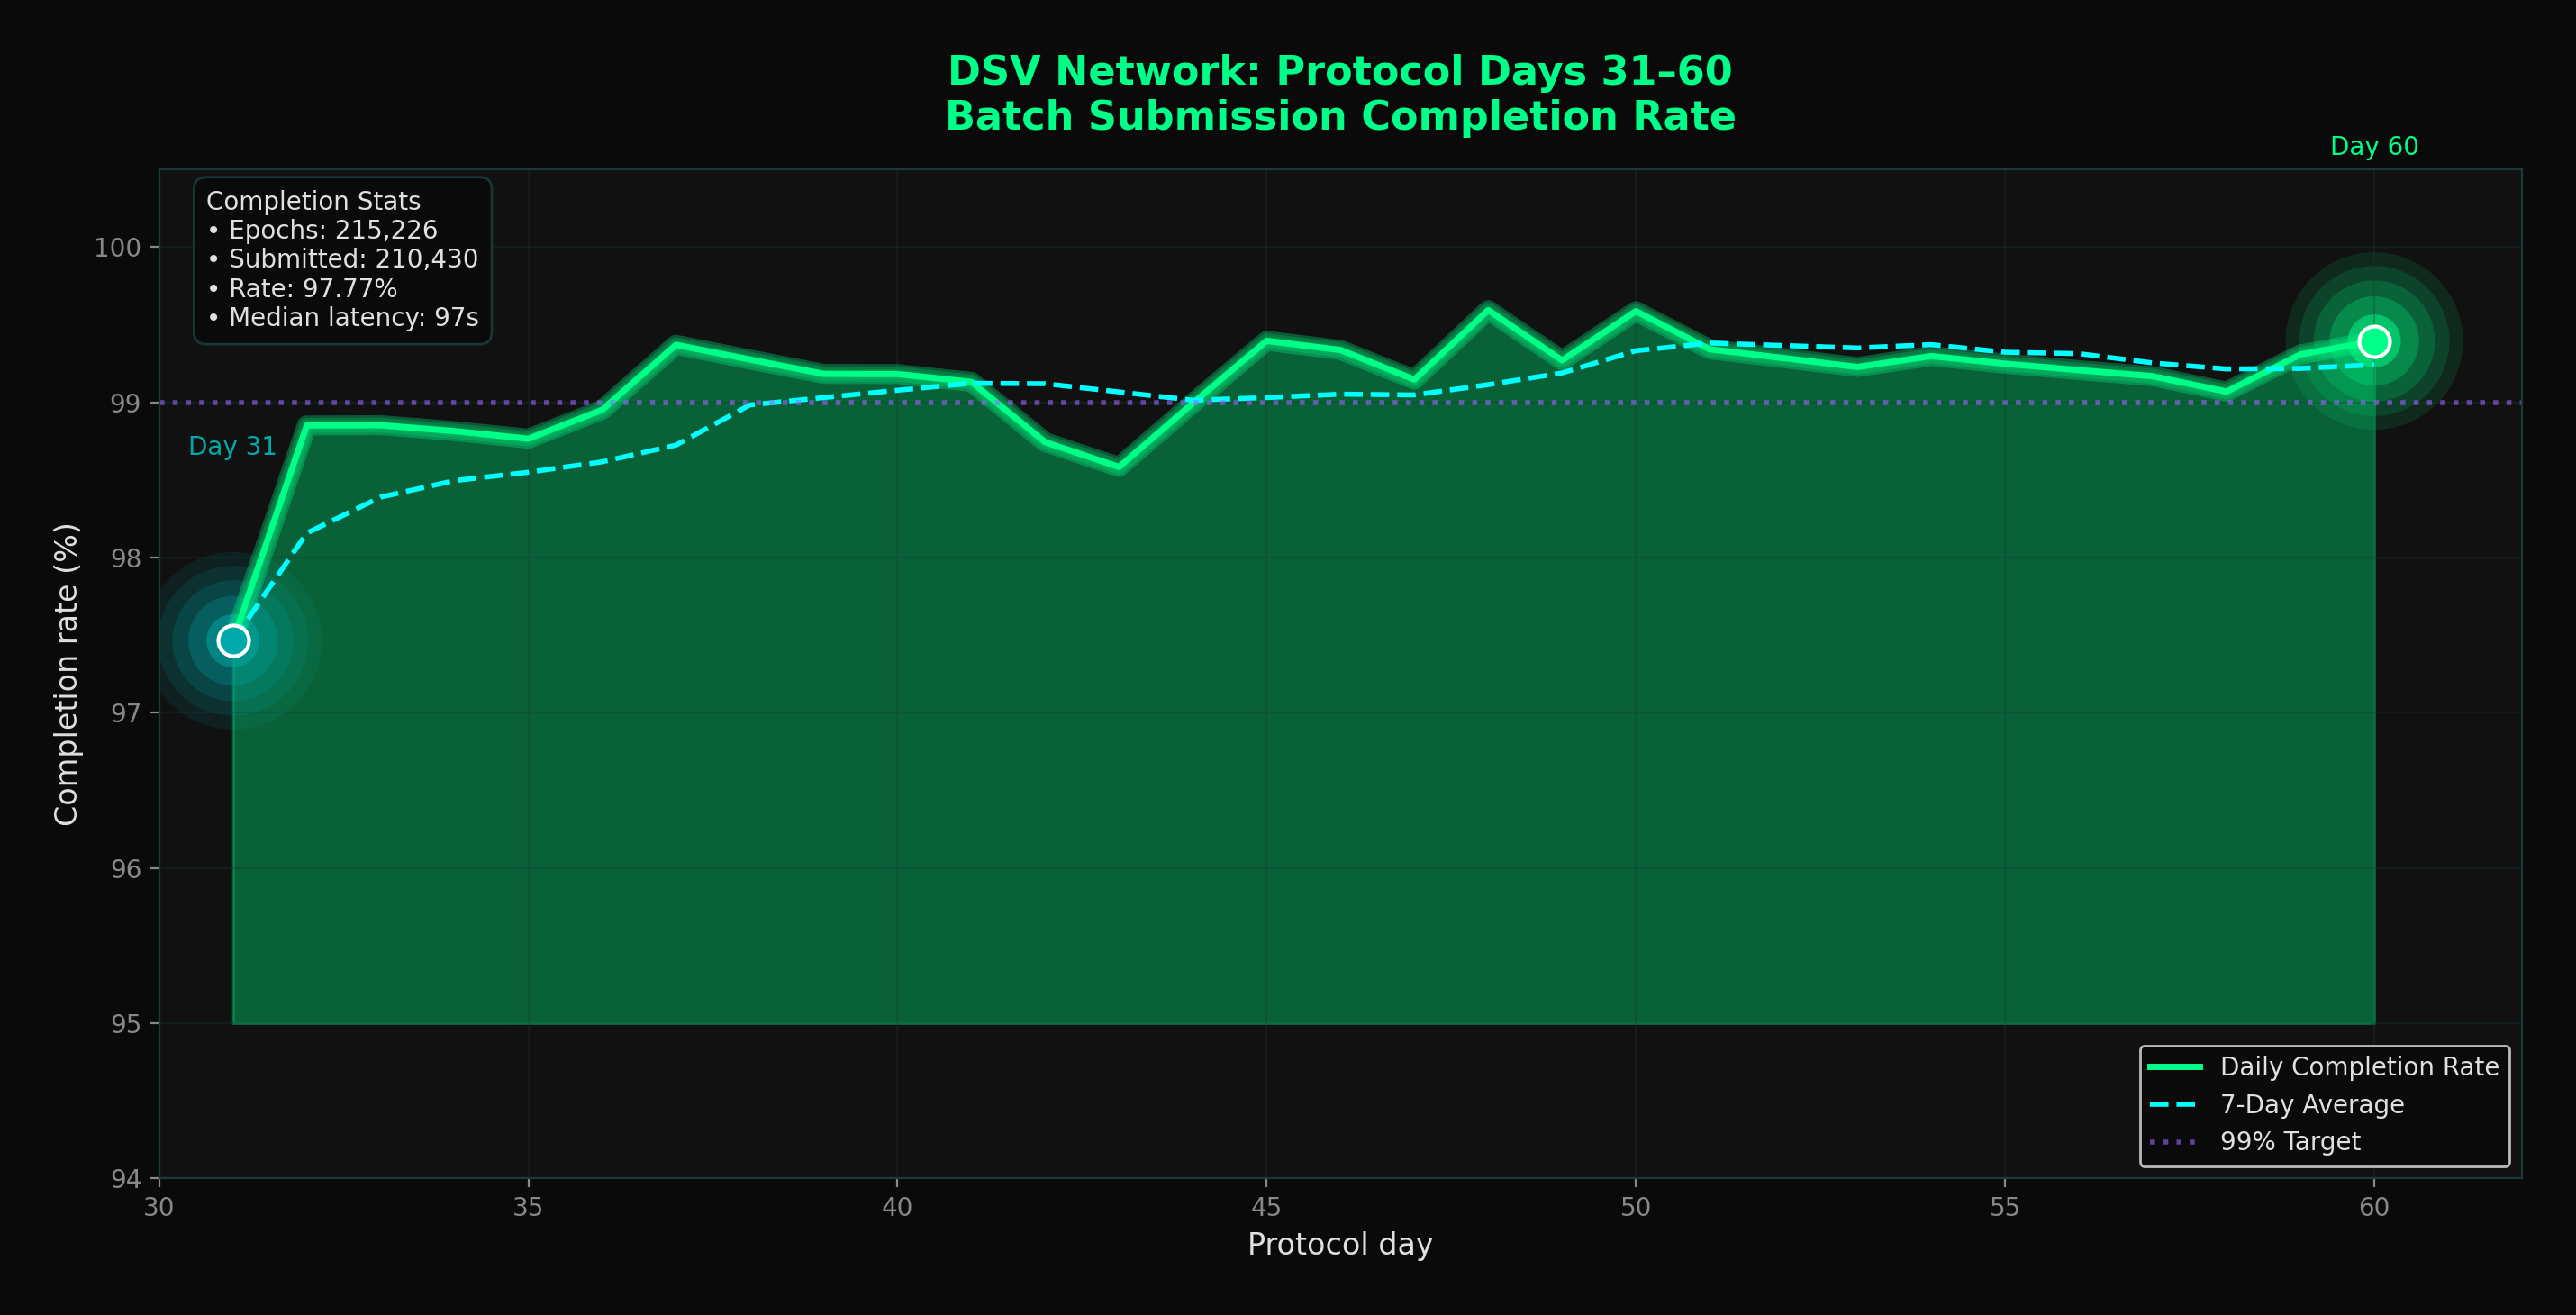
Figure 2: Daily batch submission completion rate, protocol days 31–60 (215,226 epochs assigned). 28 of 30 days at full 7,200-epoch cadence; days 49–50 were shorter L2 windows.
First 30 days (baseline window)
Detailed figures for protocol days 1–30 (historical baseline for comparisons and charts):
| Metric | Value |
|---|---|
| Total epochs assigned | 217,295 |
| Epochs with submissions | 212,297 |
| Completion rate | 97.70% |
| Median end-to-end latency | 89 seconds |
| P95 latency | 138 seconds |
| Full steady-state days (7,200 priorities/day) | 26 of 30 |
The 2.3% coverage gap clustered around brief restart windows rather than uniform random loss.
Validator performance (days 1–30)
Six validator nodes maintained 22+ consecutive active days:
| Node | Active Days | Completion Rate | Total Submitted |
|---|---|---|---|
| Node 1 | 30/30 | 99.87% | 29,670 |
| Node 5 | 30/30 | 99.90% | 49,717 |
| Node 4 | 29/30 | 99.20% | 27,252 |
| Node 3 | 28/30 | 97.42% | 33,827 |
| Node 10 | 26/30 | 98.01% | 27,690 |
| Node 11 | 22/30 | 98.79% | 25,319 |
Three additional transient nodes participated during operator testing and rotation.
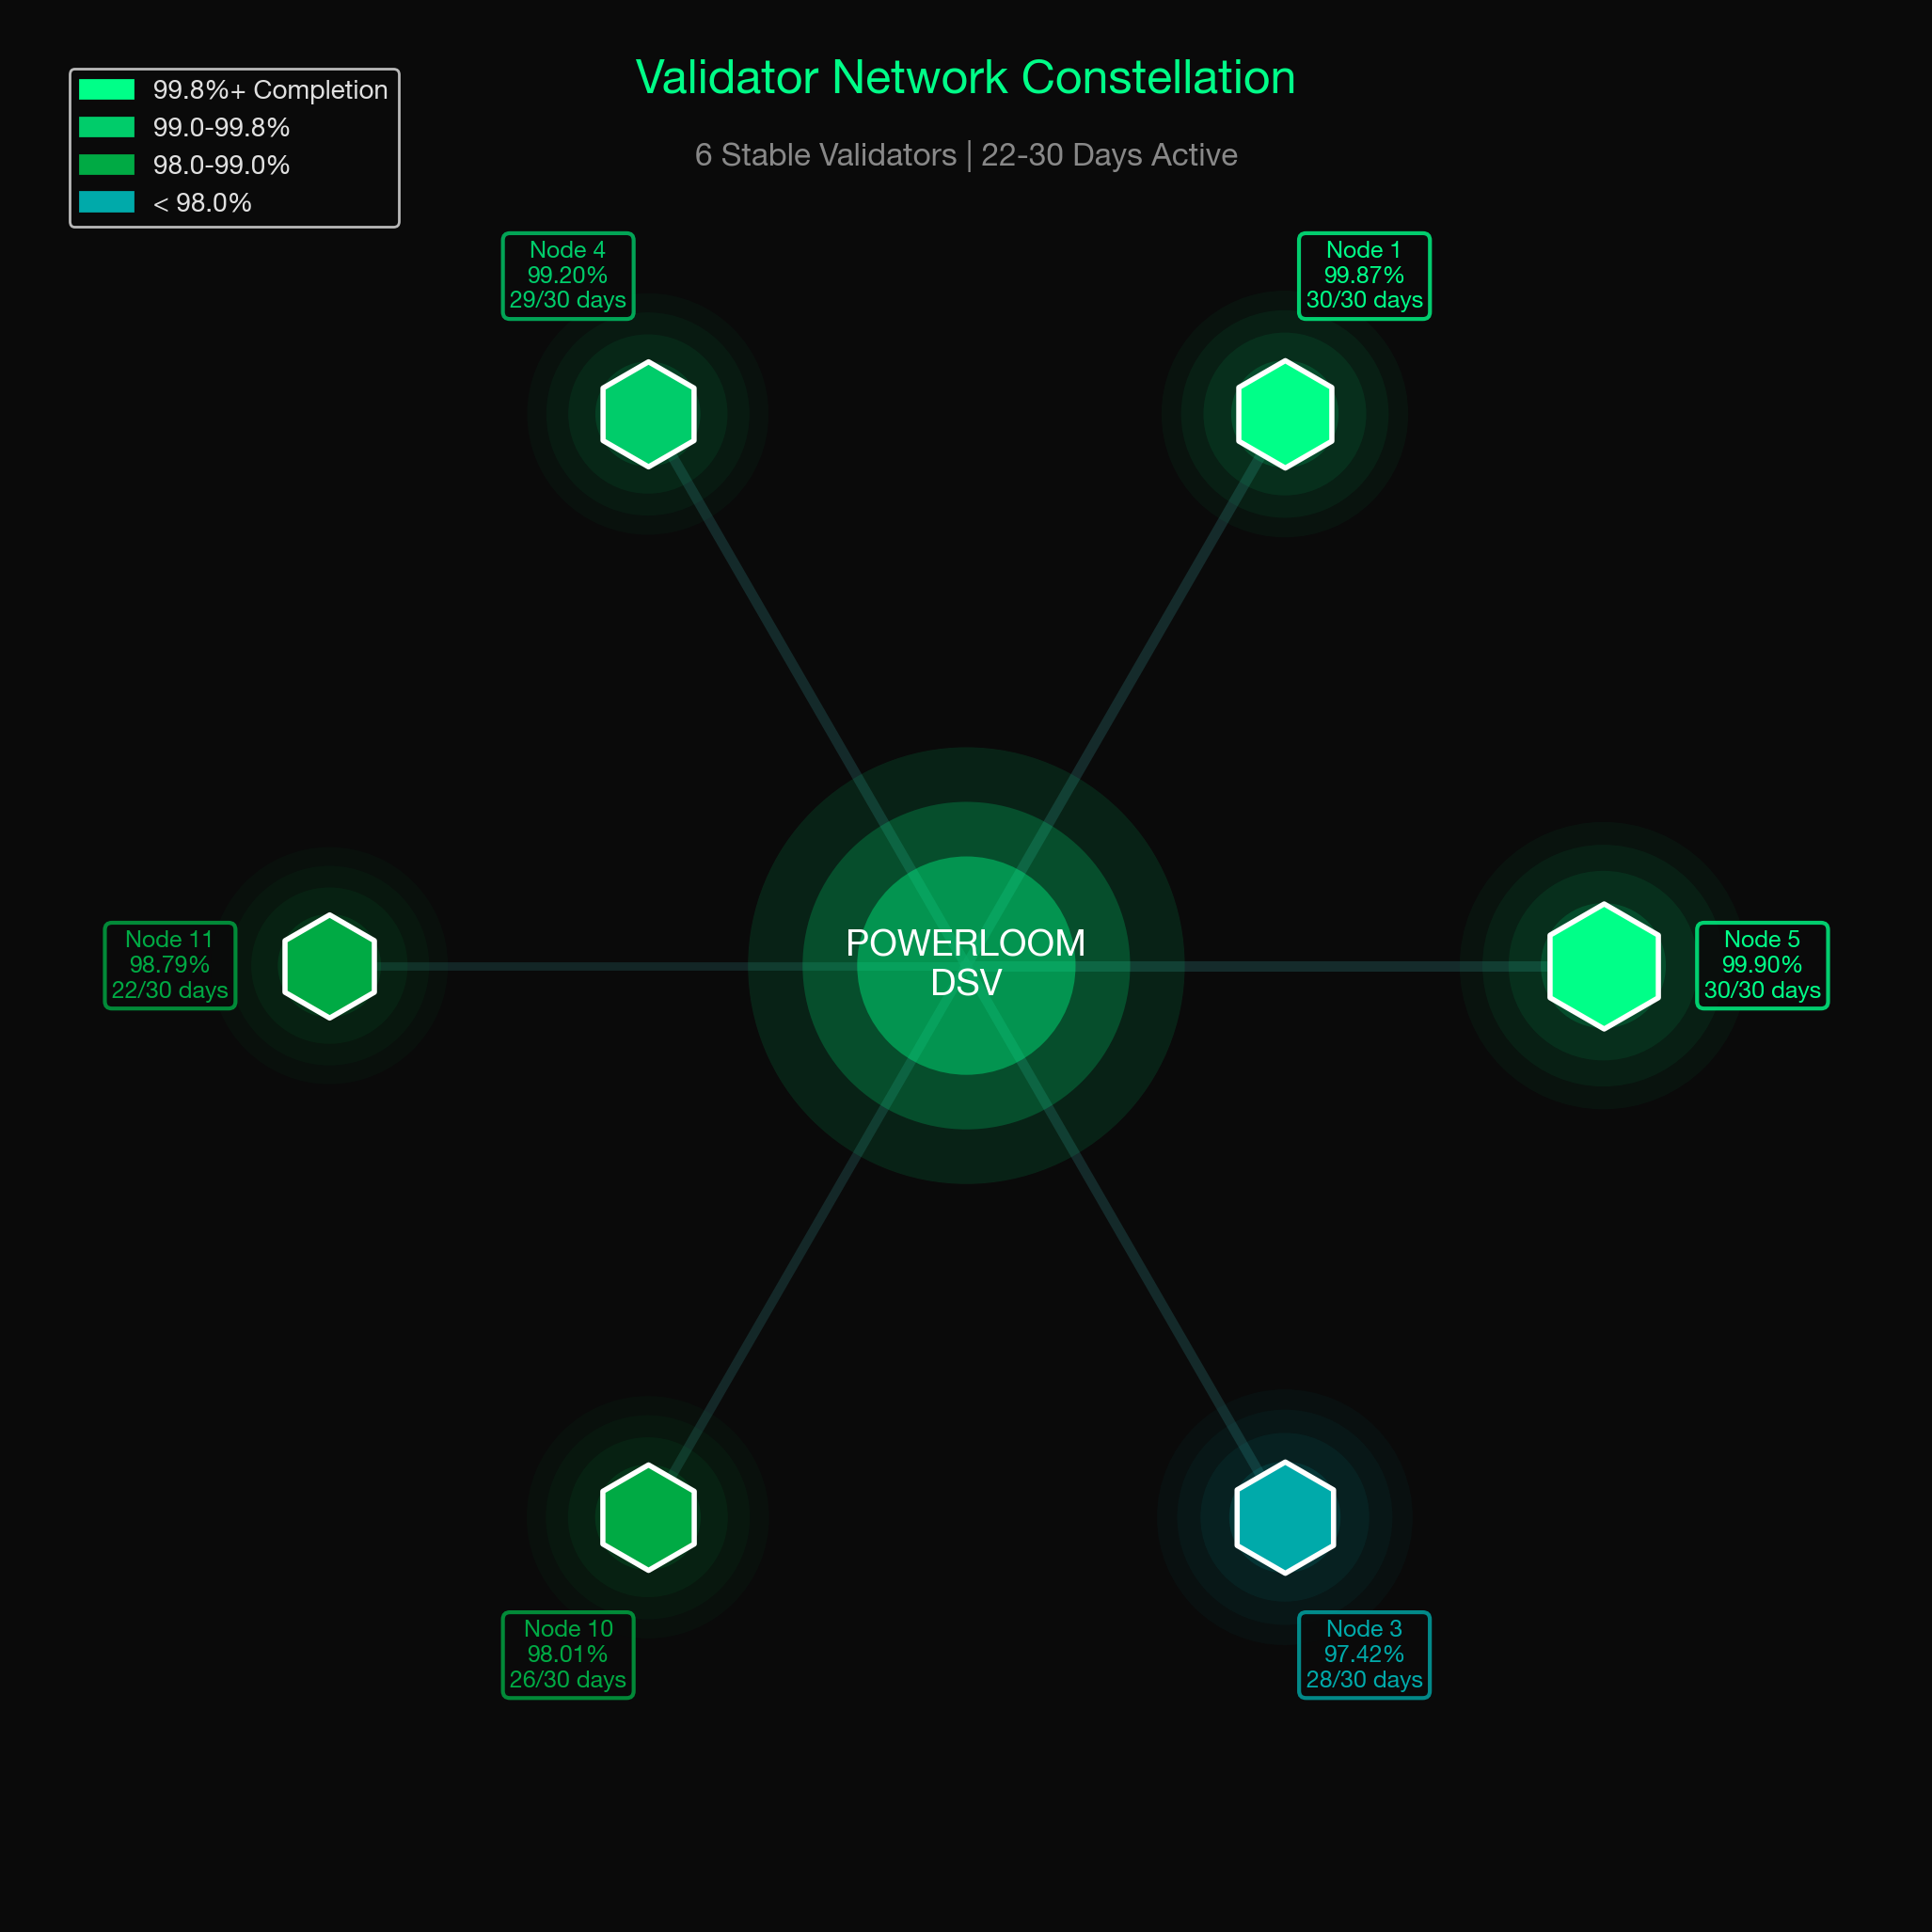
Figure 4: Validator constellation (days 1–30 window).
Days 31–60
The second production month is shown in Figure 2 above. Daily completion held in the same band as days 1–30; batch-level completion (submit → on-chain complete) averaged 99.10% across the window.
| Metric | Value |
|---|---|
| Epochs assigned | 215,226 |
| Epochs with submissions | 210,430 |
| Completion rate | 97.77% |
| Median latency | 97 seconds |
| P95 latency | 155 seconds |
| Days at 7,200 priorities/day | 28 of 30 |
| Batch submit → complete (log totals) | 208,550 / 210,437 (99.10%) |
Cadence exceptions: days 49 (6,490) and 50 (7,136) priorities — shorter L2 day windows, same class of anomaly as day 1 / day 14 in the first window.
Validator performance (days 31–60)
Fleet consolidated to five nodes at full-month uptime plus one transient:
| Node | Active Days | Completion Rate | Total Submitted |
|---|---|---|---|
| Node 5 | 30/30 | 99.99% | 70,070 |
| Node 4 | 30/30 | 99.49% | 45,434 |
| Node 1 | 30/30 | 99.92% | 39,829 |
| Node 3 | 30/30 | 97.57% | 30,472 |
| Node 11 | 28/30 | 96.27% | 23,411 |
| Node 9 | 2/30 | 99.92% | 1,221 |
Node 5 carried the largest submission share in this window (+41% vs its days 1–30 total). Nodes 2, 7, and 10 did not appear in the 31–60 summary (rotation / decommission).
Days 61–90
The third production month held the latency gains and ran epoch assignment at full cadence (29 of 30 days at 7,200 priorities/day), but submission coverage dipped to 94.64% — a 3.13-point drop from days 31–60.
| Metric | Value |
|---|---|
| Epochs assigned | 215,991 |
| Epochs with submissions | 204,416 |
| Completion rate | 94.64% |
| Median latency | 97 seconds (flat vs days 31–60) |
| P95 latency | 160 seconds |
| Days at 7,200 priorities/day | 29 of 30 |
| Batch submit → complete (log totals) | 202,641 / 204,424 (99.13%) |
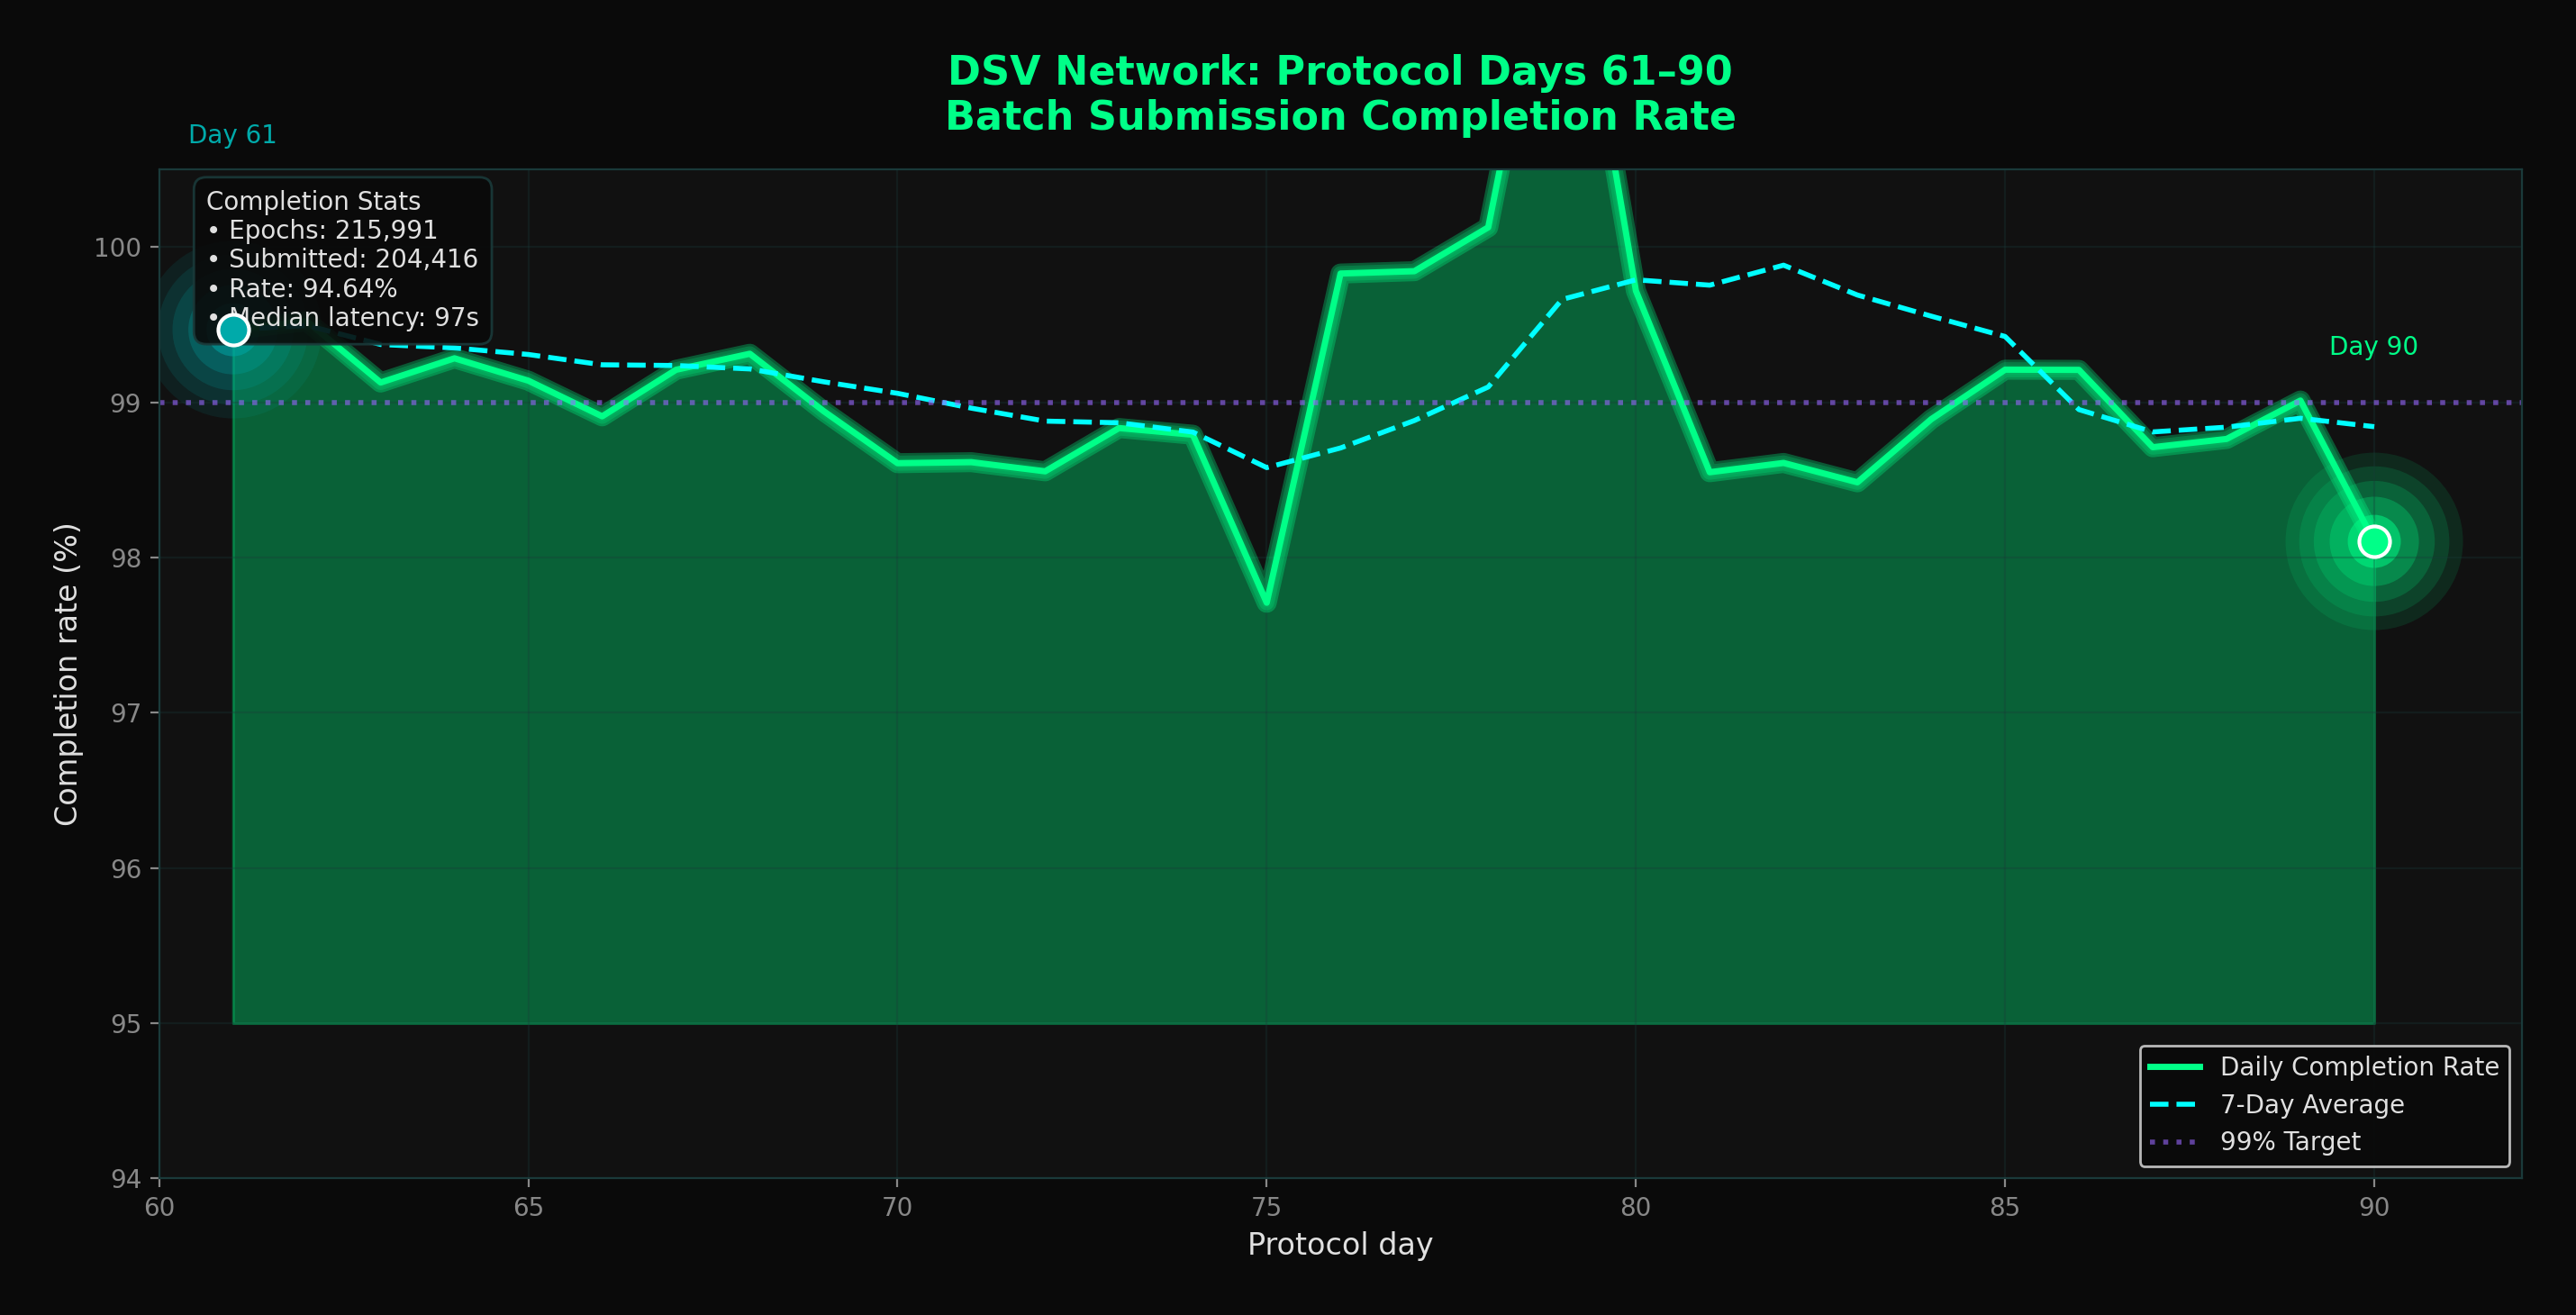
Figure 3: Daily batch submission completion rate, protocol days 61–90. Batch-level completion stays above 99% even through the coverage dip — the gap was in how many assigned epochs received a submission, not in whether submitted batches finished.
What happened, and the fix
The dip was concentrated in the final week of the window (days ~83–90), where daily submissions fell from ~7,100 toward ~6,000 of the 7,200 assigned epochs per day. Crucially, epoch assignment never dropped and batch completion stayed at 99.1% — so this was not a protocol-layer or on-chain-submission failure.
Root cause was an infrastructure issue on the bootstrap node, not the validator set: a resource (memory) leak combined with a libp2p host misconfiguration degraded gossipsub mesh stability. As the mesh destabilized, validators that were themselves online could not reliably propagate and receive finalization submissions for their assigned epochs, so coverage fell. The per-node activity swings observed in this window (for example, one node's active days dropping mid-window) were symptoms of mesh instability rather than operators leaving.
The bootstrap-node memory leak and libp2p host configuration were fixed on 2026-06-04, and the mesh has been stable since. Because the remediation landed after day 90, this window captures the degradation in full; the recovery toward the established ~97.7% coverage baseline will be reflected in the subsequent (days 91+) reporting window.
Submission Latency
Latency is measured from priority assignment (PrioritiesAssigned) to on-chain batch submission (SnapshotBatchSubmitted).
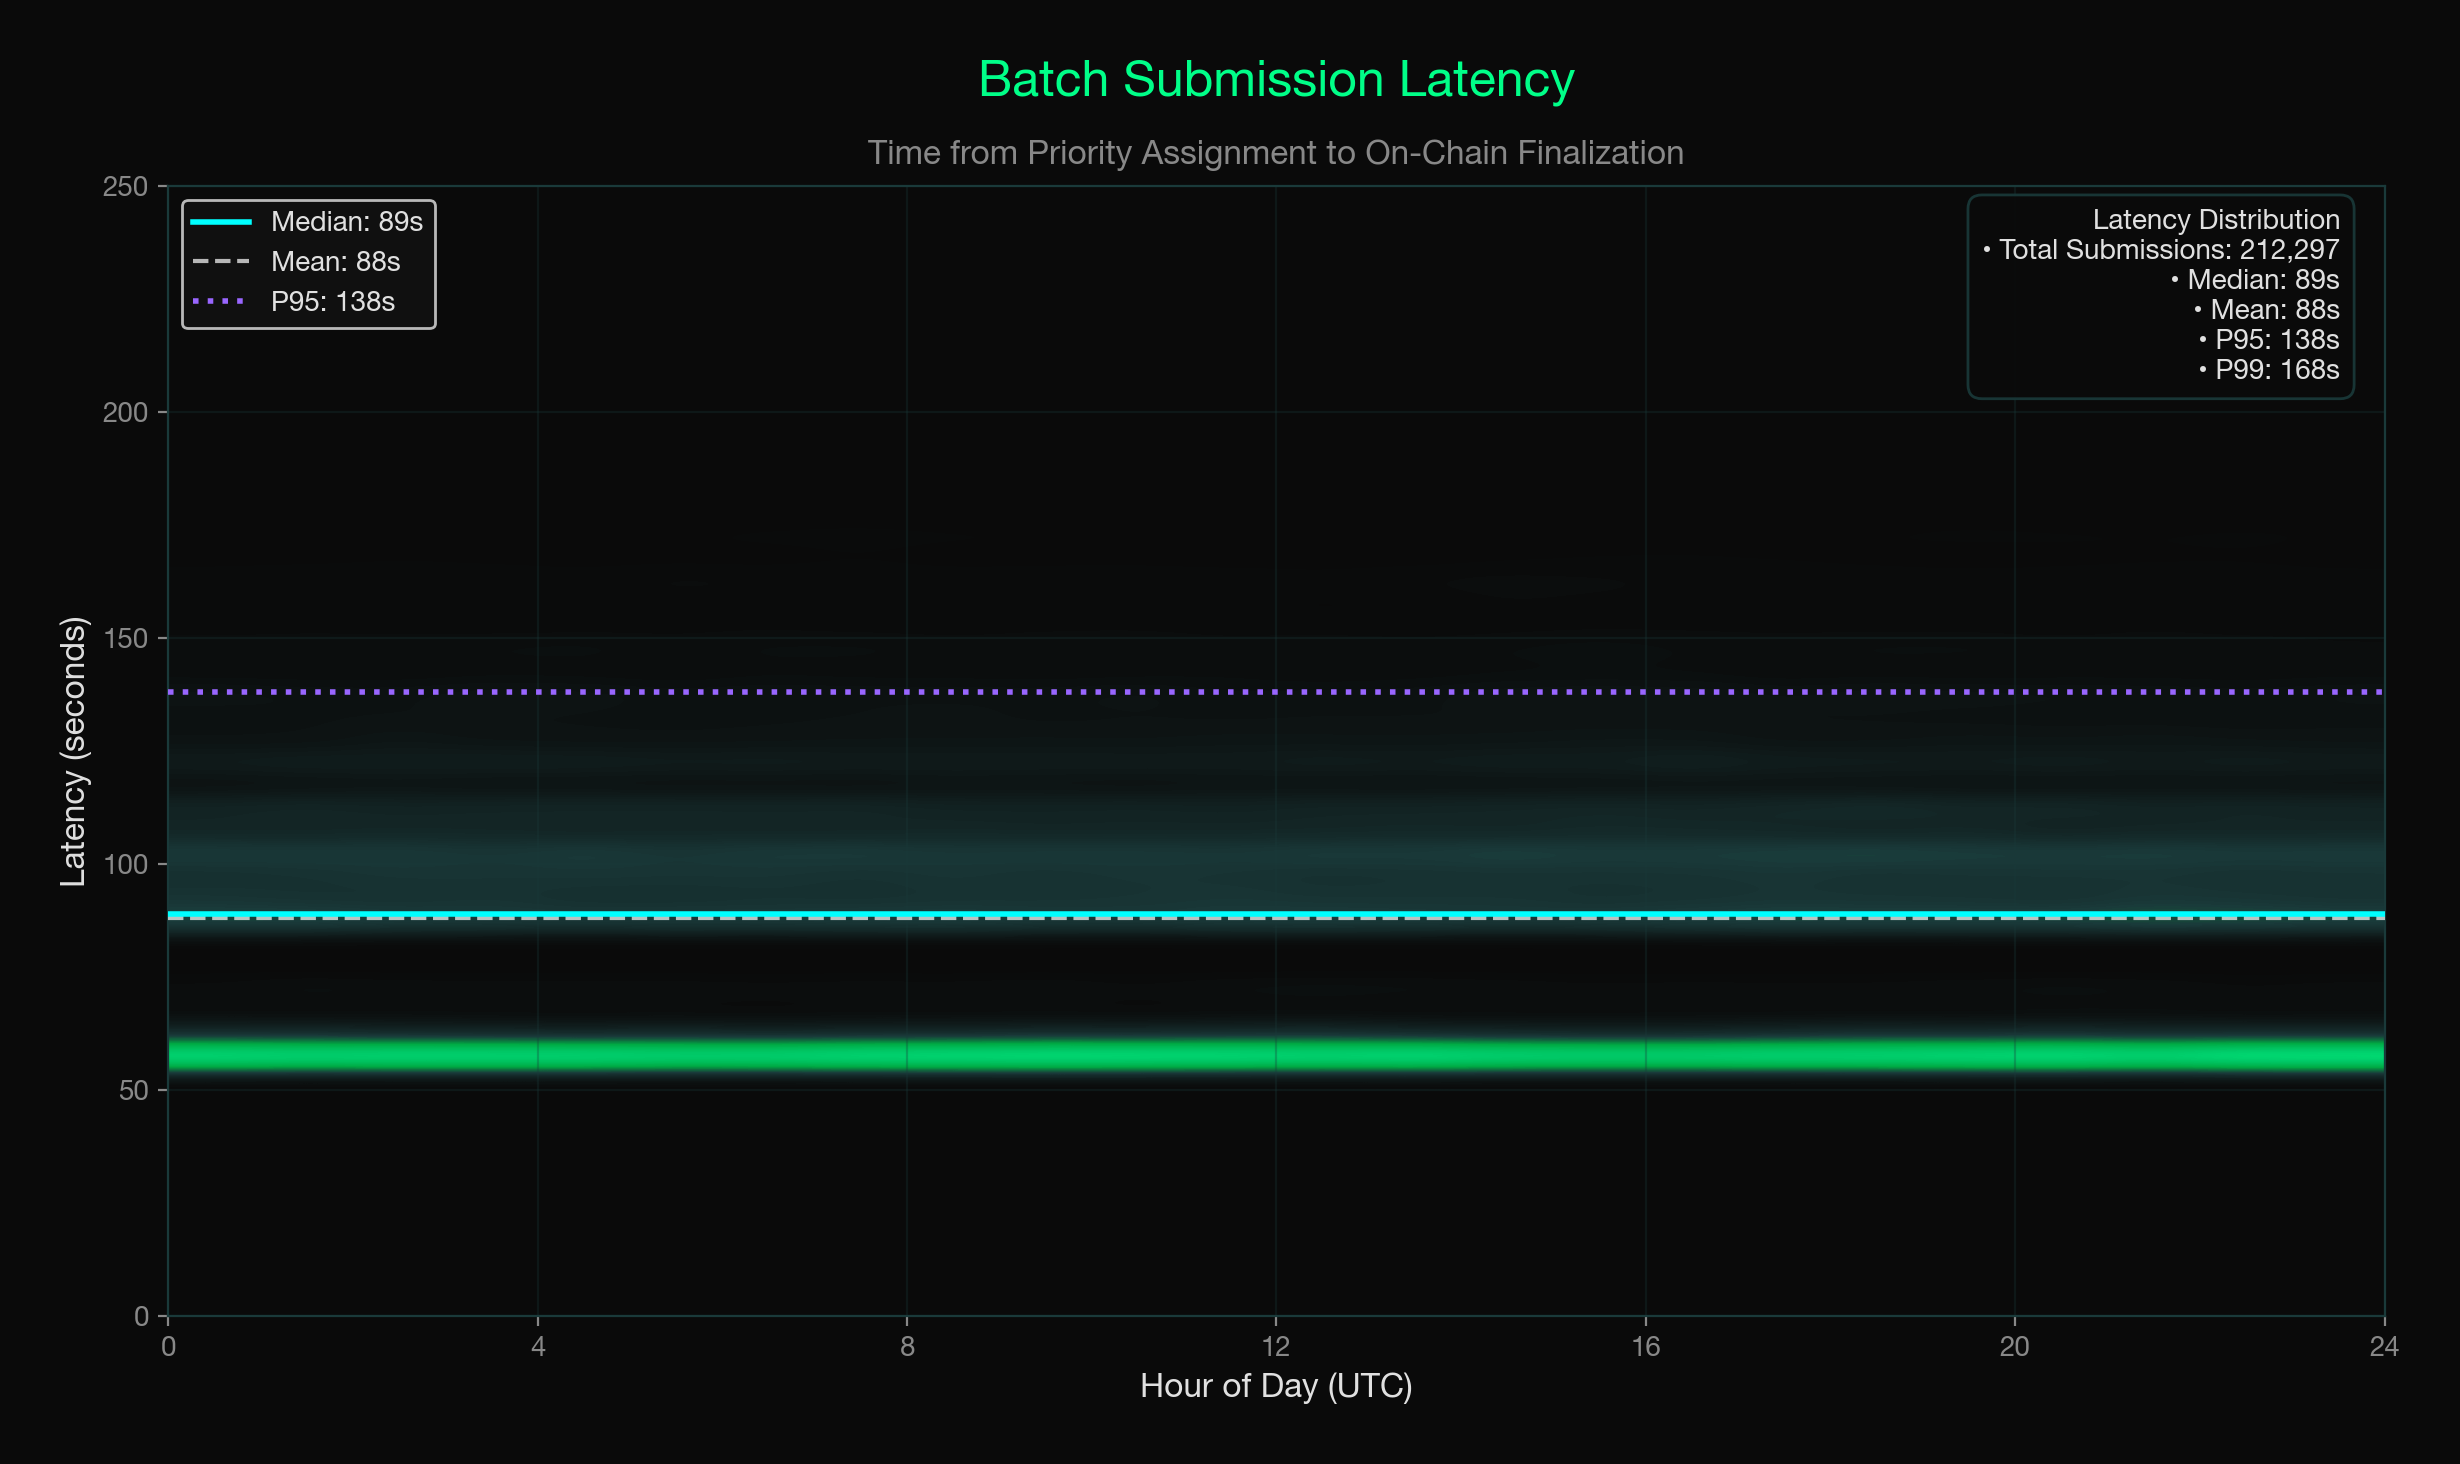
Figure 5: Latency distribution (days 1–30 chart). Median 89s → 97s in days 31–60, then flat at 97s in days 61–90; P95 138s → 155s → 160s.
Patterns remain consistent across hours of day in the first window; the second window shows a modest shift toward higher absolute latency without a coverage regression.
Epoch Coverage Pattern
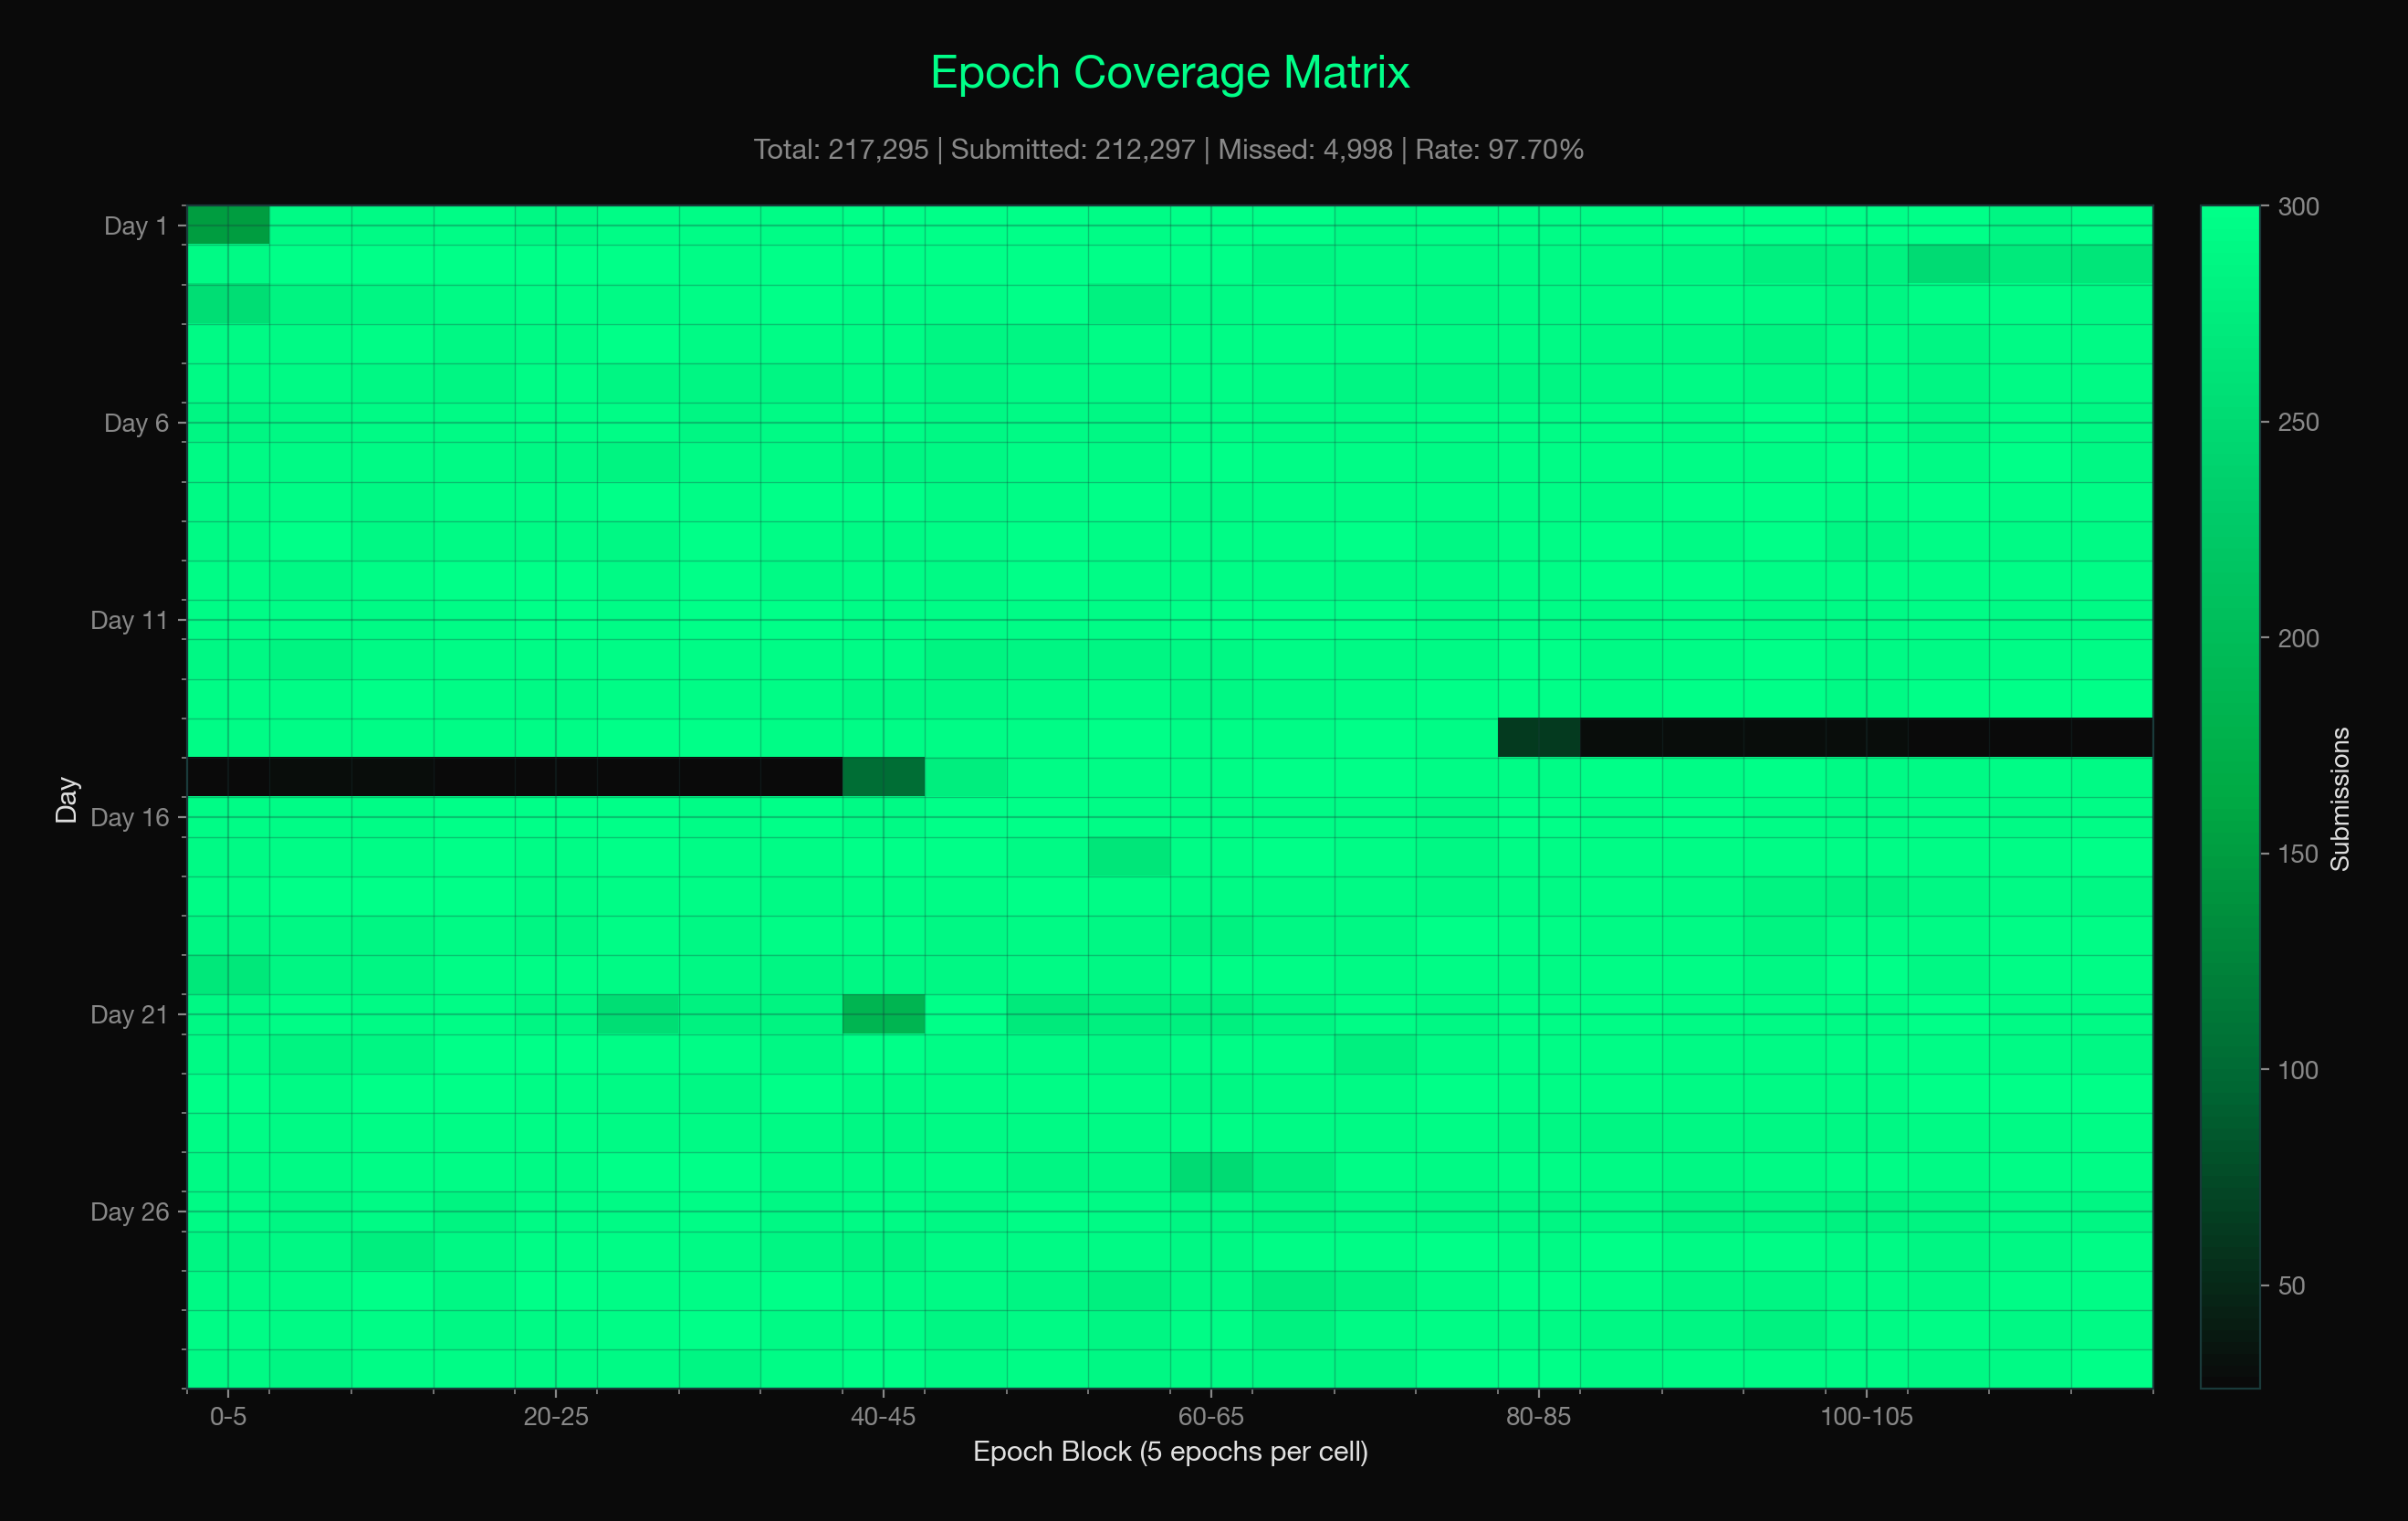
Figure 6: Coverage matrix (days 1–30). Gaps cluster at operational transitions, not random scatter.
Snapshotter Participation
Separate measurement of 1,811 epochs (April 17–24) — snapshotter / slot layer (not validator export):
| Metric | Value |
|---|---|
| Unique eligible nodes per day | 2,970 – 3,047 |
| Median eligible nodes per epoch | 305 |
| Active validators per epoch | 3–5 (median 4) |
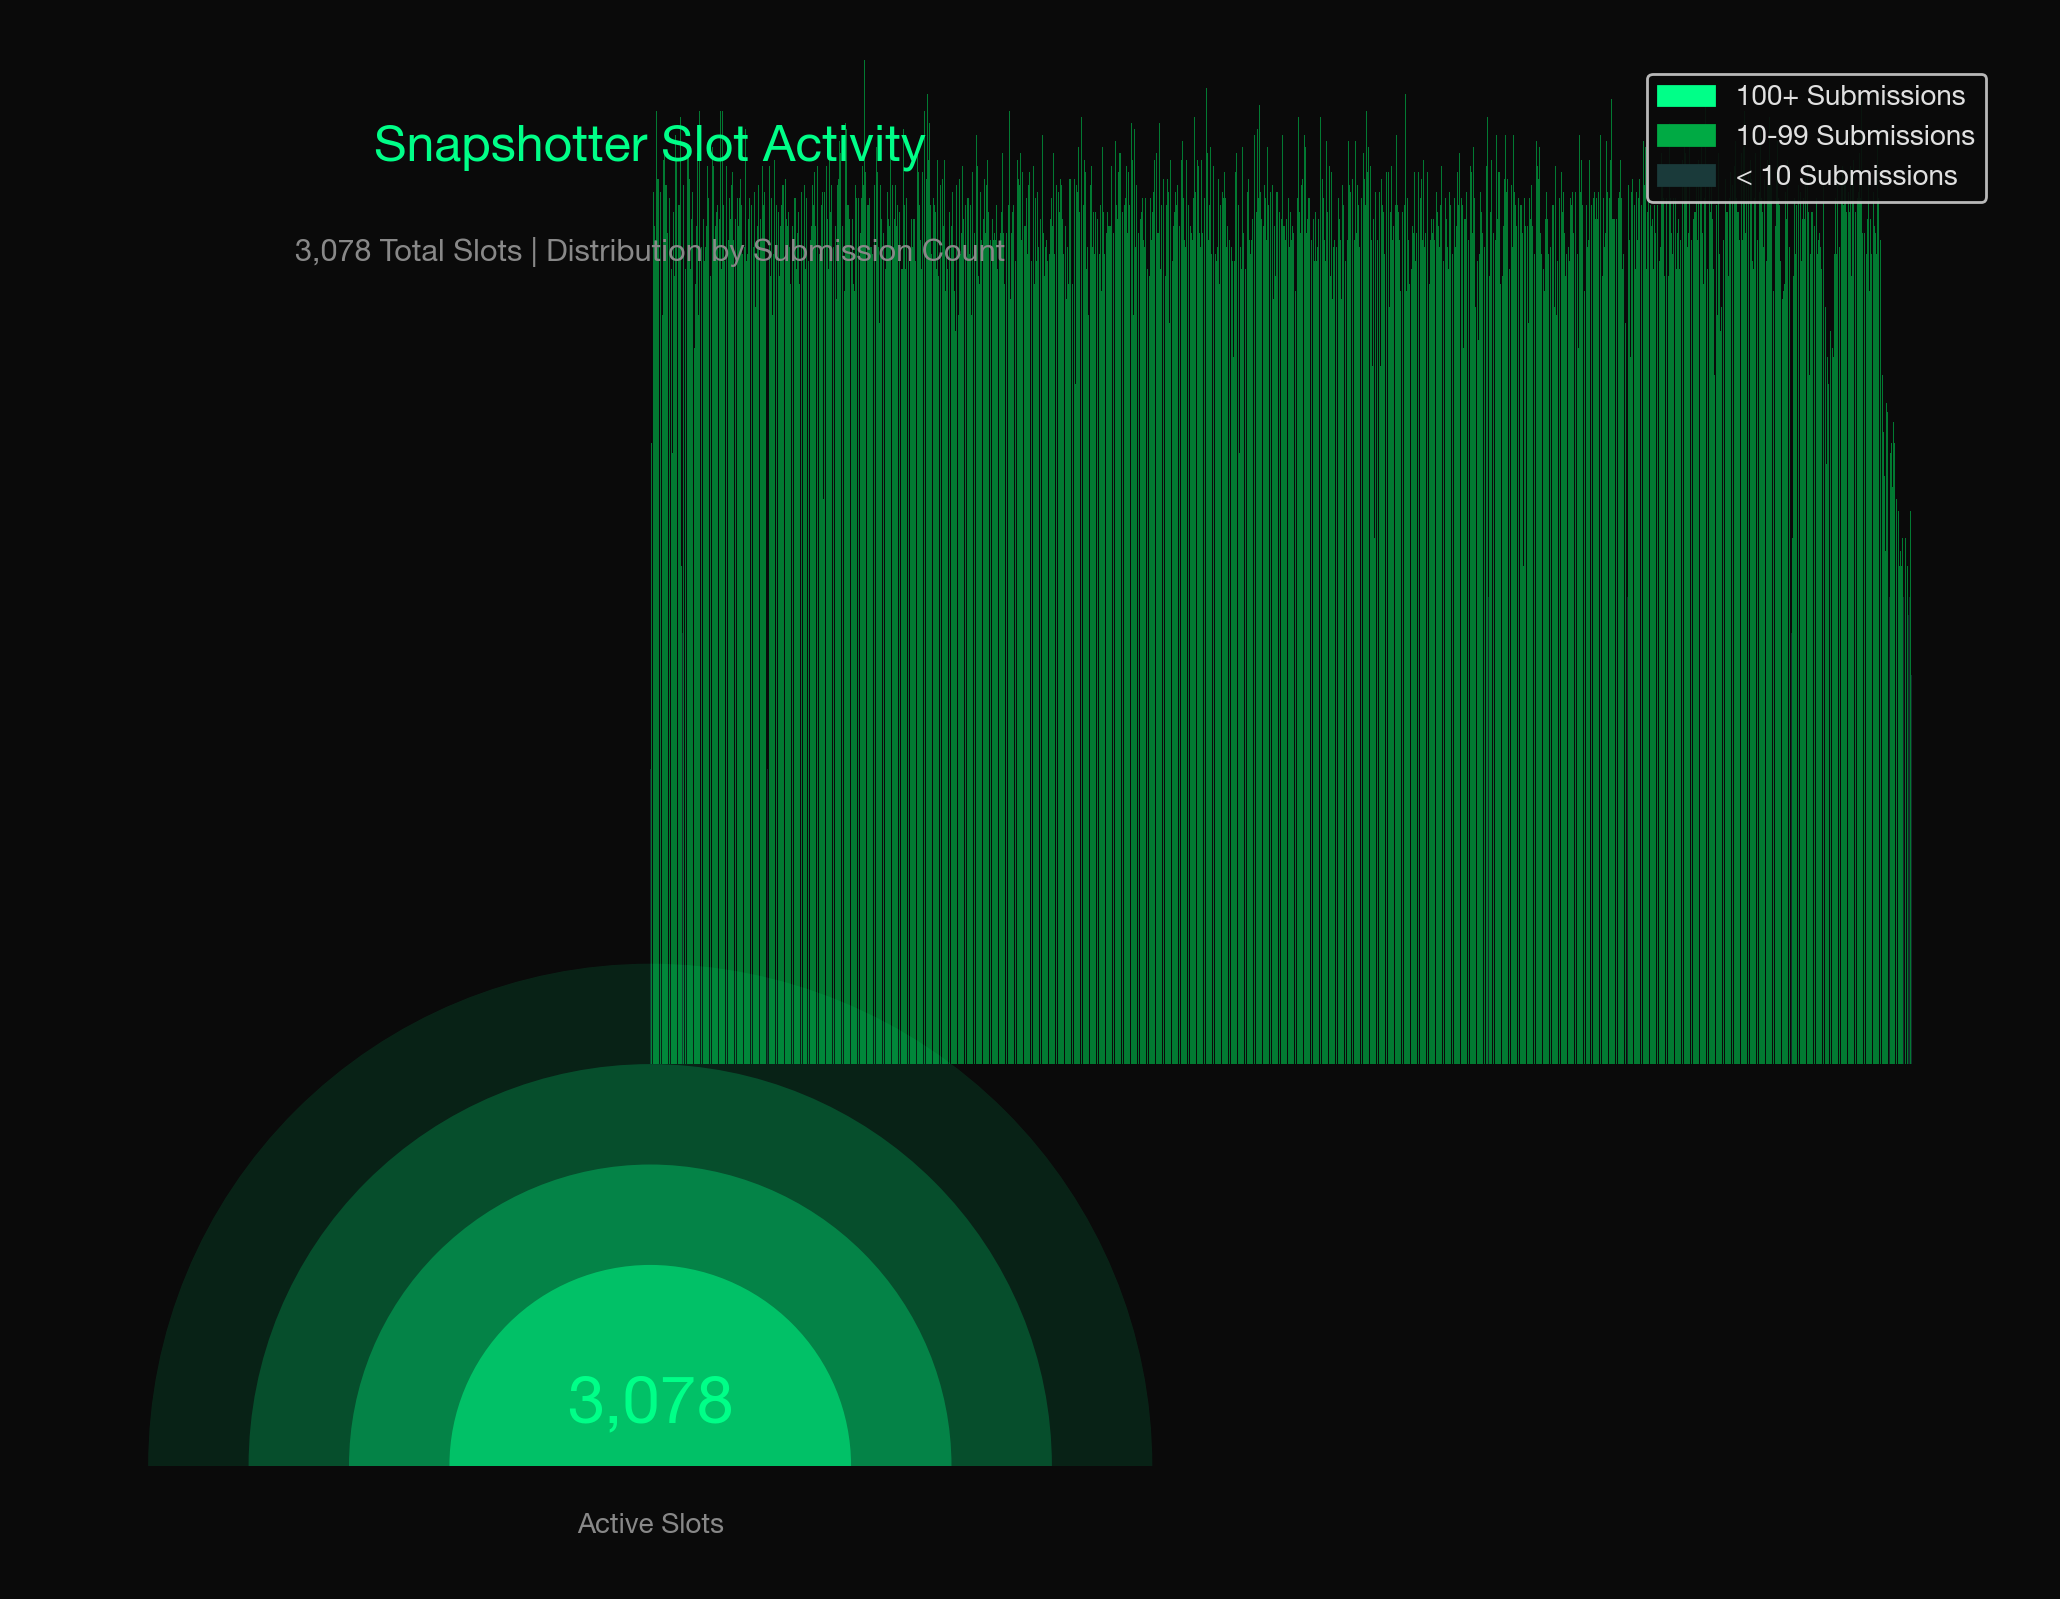
Figure 7: Slot activity sample (3,078 slots).
What These Figures Show
Continuous cadence under pressure
BDS mainnet processes block-aligned epochs on Ethereum mainnet. 648k+ assigned epochs over 90 protocol days with 96.7% submission coverage shows sustained operation under continuous pressure — including through a recoverable infrastructure incident in the third month.
Measurable validator participation
- Five stable validators at full-month uptime in days 31–60
- ~3,000 eligible snapshotter nodes per day (separate tally sample)
- 99%+ batch completion once a validator commits to submit (held even through the days 61–90 coverage dip)
Observable mesh health
P2P mesh stability is a first-order input to coverage, as the days 61–90 window demonstrated: when the gossipsub mesh degraded (a bootstrap-node resource leak plus a libp2p host misconfiguration, fixed 2026-06-04), online validators still missed assigned epochs because submissions could not propagate reliably. Local-collector health states (healthy / degraded / pruned) and peer counts are tracked as part of the operational story; see deployment docs for collector configuration.
Related Pages
Methodology and Reproducibility
- On-chain export —
export_validator_activity.pywith archivePOWERLOOM_RPC_URL(Powerloom L2) - Epoch participation —
analyze_epoch_participation.py→participation_summary.json - Per-node reliability —
analyze_validator_reliability.py→reliability_summary.json - Window comparison —
compare_windows.pybetween output directories - Charts —
generate_visualizations.py→reports/charts/(e.g.dsv_network_health_timeline_days_31_60.png)
Committed artifacts: github.com/powerloom/dsv-validator-activity/reports — includes days-61-90/network_health_daily.csv, combined-days-1-90/summary.json, and chart PNGs under reports/charts/.
Contracts (BDS mainnet):
- ProtocolState:
0x1d0e010Ff11b781CA1dE34BD25a0037203e25E2a - DataMarket:
0x26c44e5CcEB7Fe69Cffc933838CF40286b2dc01a
Last updated: 2026-06-05