Datapoints
In Aave V3-Pooler, data points are specific, quantifiable elements derived from Aave V3 lending activities.
Each snapshot inherits SnapshotBase which looks something like this:
https://github.com/powerloom/snapshotter-computes/blob/6fb98b1bbc22be8b5aba8bdc860004d35786f4df/utils/models/message_models.py#L9-L17
Base Snapshots
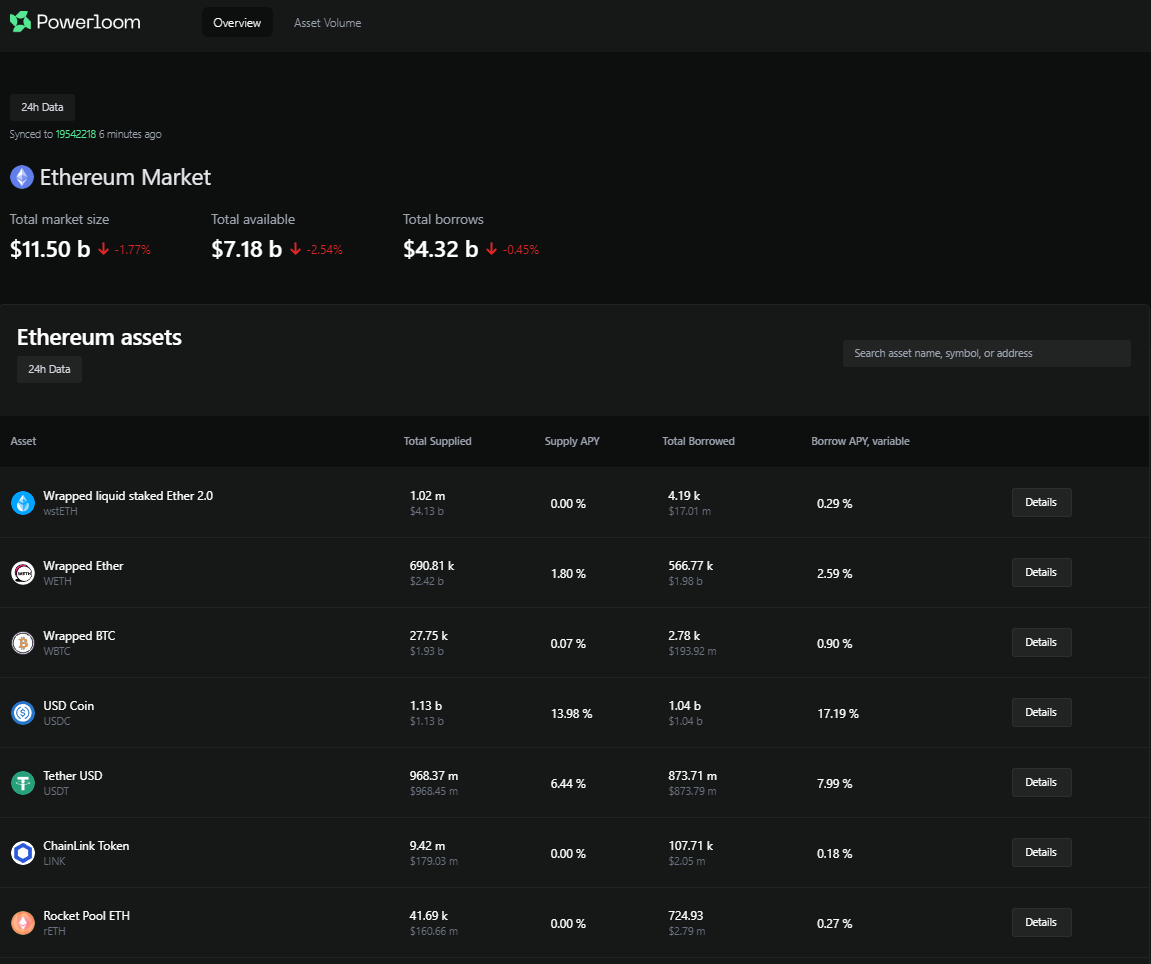
The following type of Base Snapshots are generated for the Aave V3 dashboard:
1. Asset Metrics Snapshot
The Asset Metrics refer to the total supplied and borrowed amounts, supply and borrow interest rates, and the indices used to compute future rate changes. The asset snapshot looks something like this:
https://github.com/powerloom/snapshotter-computes/blob/aave/utils/models/message_models.py#L26-L42
1a. AaveSupplyData / AaveDebtData
The nominal token amount and the token amount in terms of USD at the time of snapshotting:
https://github.com/powerloom/snapshotter-computes/blob/aave/utils/models/data_models.py#L65-L72
1b. AssetDetailsData
Additional asset details include the maximum loan-to-value ratio, liquidation information, the asset's reserve factor, borrow/supply caps, and available eMode options.
For further information, please see the Aave V3 Protocol Documentation.
https://github.com/powerloom/snapshotter-computes/blob/aave/utils/models/data_models.py#L25-L34
1c. RateDetailsData
Additional rate details describing the interest rate strategy for the asset.
For further information, please see the Aave V3 Protocol Documentation.
https://github.com/powerloom/snapshotter-computes/blob/aave/utils/models/data_models.py#L37-L45
2. Volume-by-Action Snapshot
The asset's total volume-by-action for the Epoch, and the corresponding events for each action emitted by the blockchain. The volume-by-action snapshot looks something like this:
https://github.com/powerloom/snapshotter-computes/blob/aave/utils/models/message_models.py#L91-L98
2a. volumeData
The total nominal token volume and the volume in terms of USD at the time of snapshotting:
https://github.com/powerloom/snapshotter-computes/blob/aave/utils/models/data_models.py#L92-L94
2b. liquidationData
Additional details describing a liquidation action:
https://github.com/powerloom/snapshotter-computes/blob/aave/utils/models/data_models.py#L117-L122
Aggregate Snapshots
The above base snapshots are used as the data source for higher-order aggregates. These aggregates are then used to generate the data points present on the Aave V3 Dashboard. Refer to data-composition for more details on how data points are composed.
The following aggregate snapshots are generated by AaveV3-Pooler using base snapshots:
1. Top Assets by Marketshare Snapshot
All assets are organized by the total market share on the protocol. The top assets by marketshare snapshot look something like this:
https://github.com/powerloom/snapshotter-computes/blob/aave/utils/models/message_models.py#L55-L69
2. 24 Hour Volume-by-Action Snapshot
24-hour volume-by-action for each asset per Epoch. The 24-hour volume-by-action snapshot looks something like this:
https://github.com/powerloom/snapshotter-computes/blob/aave/utils/models/message_models.py#L101-L107
3. Top Assets by Volume Snapshot
All assets are organized by their 24-hour total volume-by-action. The top assets by volume snapshot looks something like this:
https://github.com/powerloom/snapshotter-computes/blob/aave/utils/models/message_models.py#L110-L128
4. 6 Hour Average Rates Snapshot
Average supply and borrow rates over the previous 6 hours for each asset per Epoch. The 6-hour average rate snapshot looks something like this:
https://github.com/powerloom/snapshotter-computes/blob/aave/utils/models/message_models.py#L82-L88
5. 24 Hour Total Market Stats Snapshot
24-hour stats for the entire Aave lending market. The 24-hour stats snapshot looks something like this:
https://github.com/powerloom/snapshotter-computes/blob/aave/utils/models/message_models.py#L72-L79